Continuing from Part 1 and Part 2, this is the third and last post about how I reverse engineered a few off-the-shelf wireless temperature, humidity, and rain sensors, and used an Arduino to listen to and decode the sensor data. Update: RPi is also supported now! Check the provided programs at the end of this post.
Wireless Rain Sensor
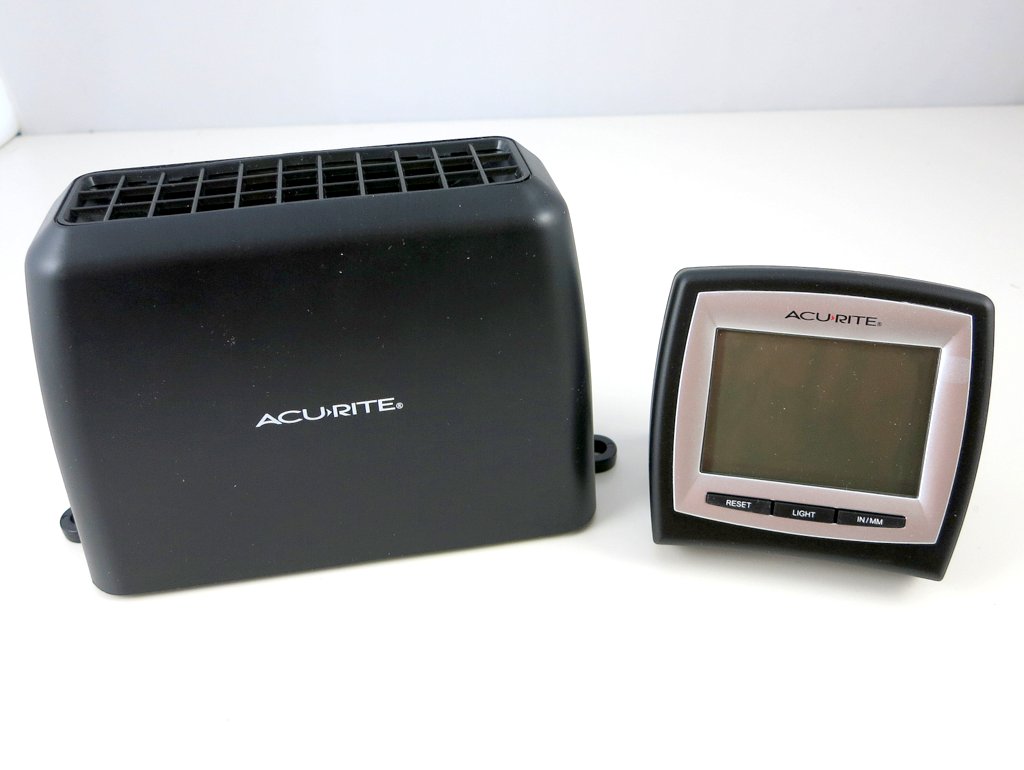
Raw Waveform. There are several different wireless rain sensors on the market. My first target was an Acu-Rite 00875W rain gauge. I bought it two years ago and I don’t know if it’s still available now. This sensor turns out to be a huge pain. The main problem is that I can’t even register a consistent reading at 0 — every time I pop in the battery, I get a different signal that seems to have nothing to do with the previous readings. Also, the 0/1 bit patterns are completely unclear from the captured waveform — there are at least 4 or 5 different wavelengths. Here are two examples of the captured waveforms. They look nothing alike, even though both were captured right after the batteries are popped in and no rain has been detected.
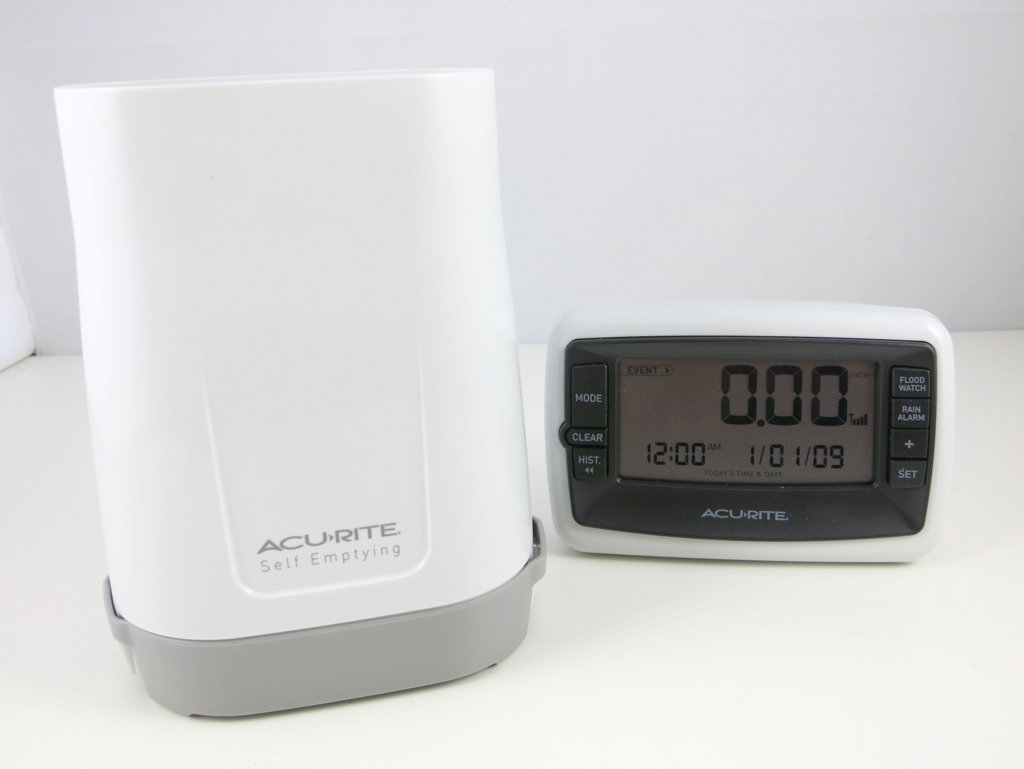
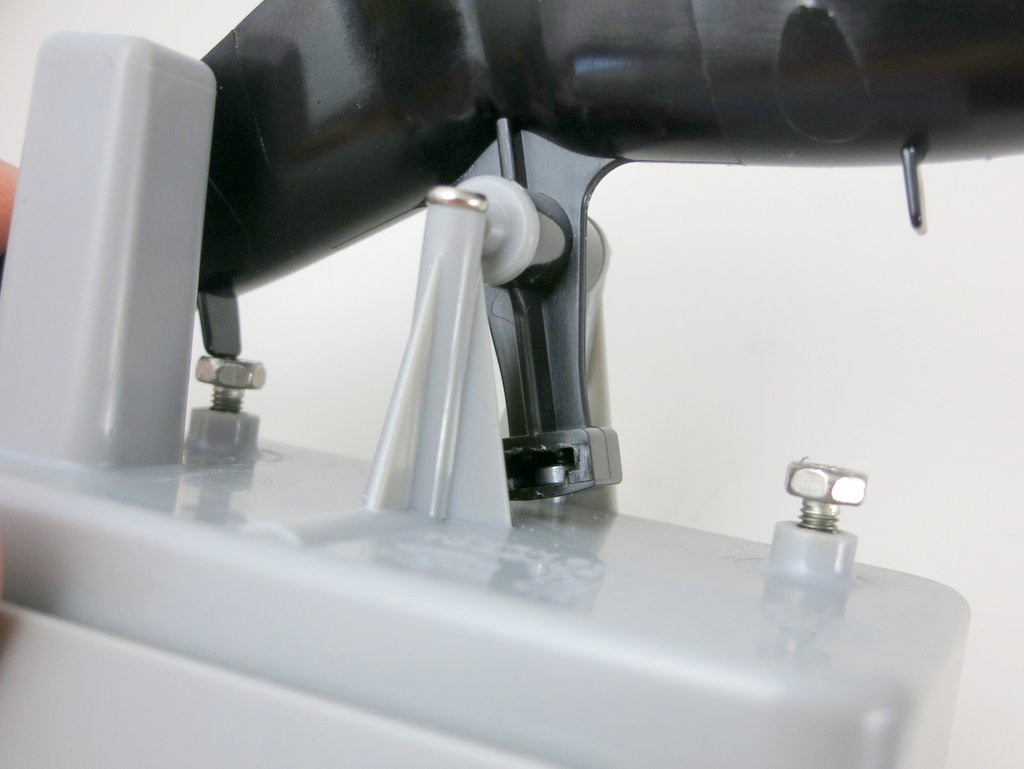
After pulling my hair for a couple of days and finding no clue at all, I decided to give it up and try a different model. This time I bought an Acu-Rite 00899 wireless rain gauge. It’s probably worth explaining at first how the rain gauge works, because it’s quite a clever design. The outside of the transmitter unit looks like a bucket. Underneath the bucket is a plastic seesaw which swings left and right. Basically the rain water drains through the bucket hole onto the seesaw, and creates some motion to be detected.
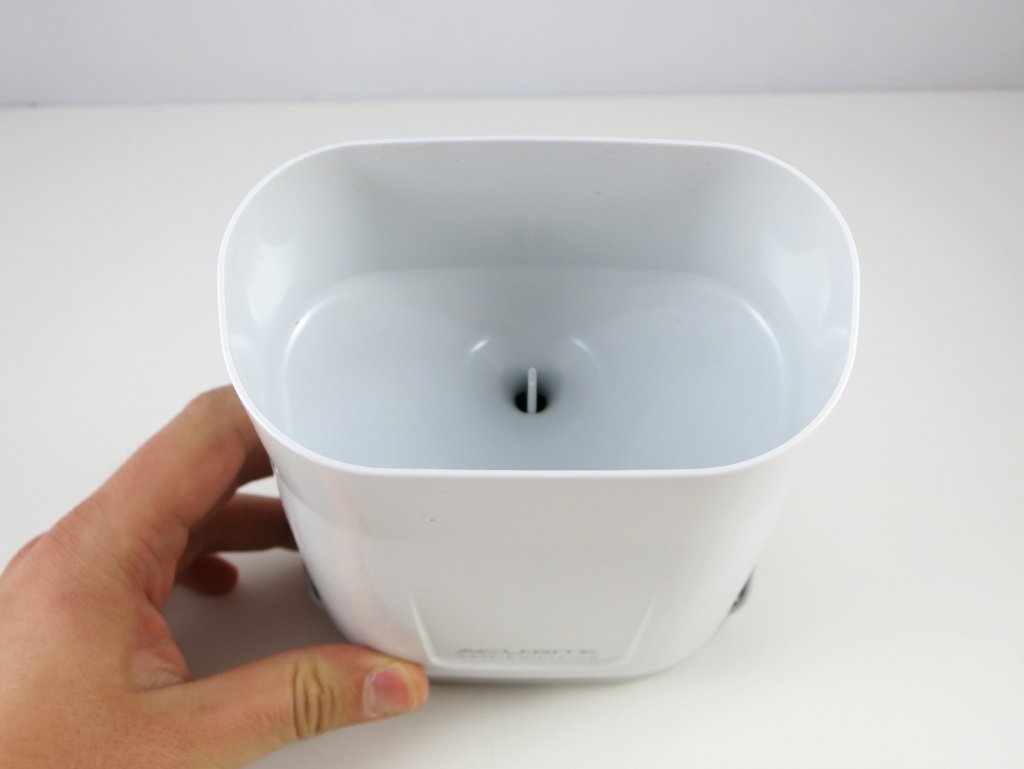

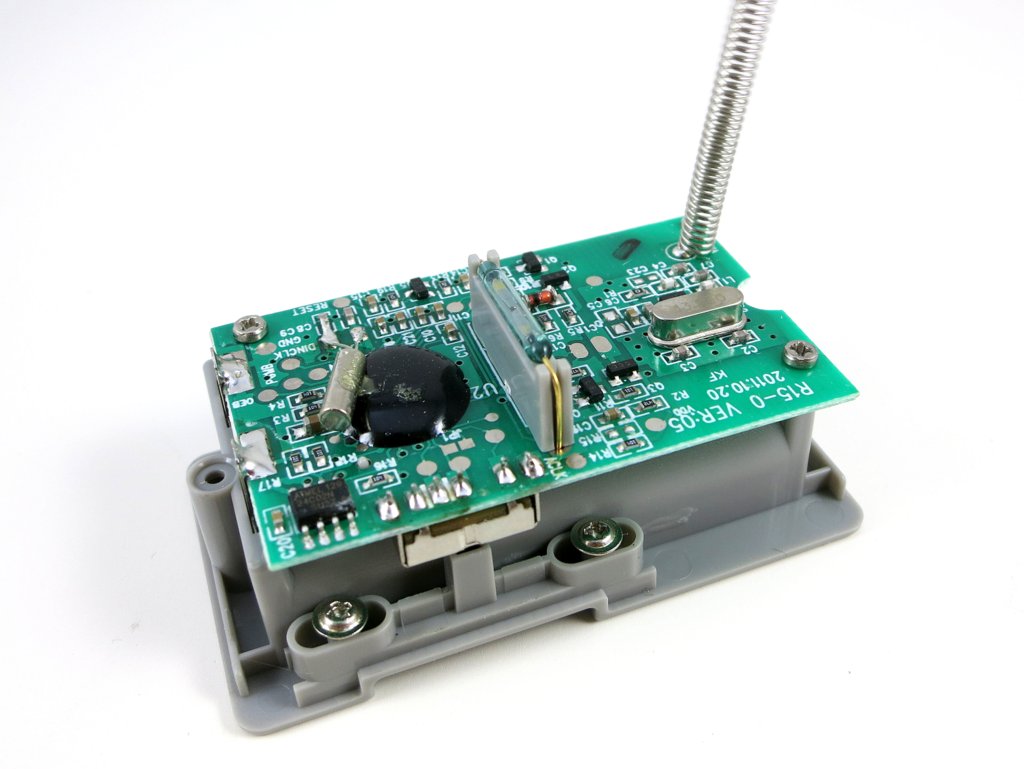
At the bottom of the assembly is the battery compartment. Remove some tiny screws, the transmitter circuit is finally revealed. At the center is a reed switch, which is normally open but will close if there is a magnet nearby. It is very sensitive to magnetism. So where is the magnet? It’s on the bottom of the seesaw. The way this works is quite neat: the seesaw swings left and right, every time the magnet passes by the reed switch, it triggers a click. By detecting how many clicks there are within a given time, we know how heavy the rain is. Clever!

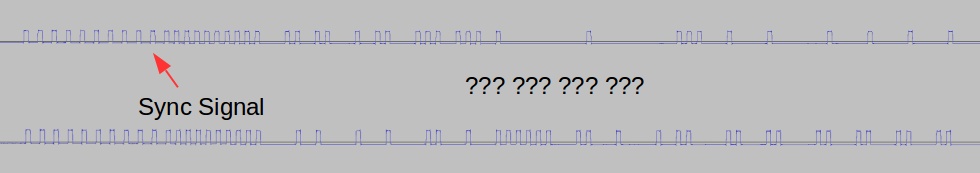
So let’s see if this rain gauge is easier to tackle. Following the same procedure as before, pop in the battery, power on the RF sniffing circuit, and launch the Audacity recording software, I got a waveform like the one shown in the image below.
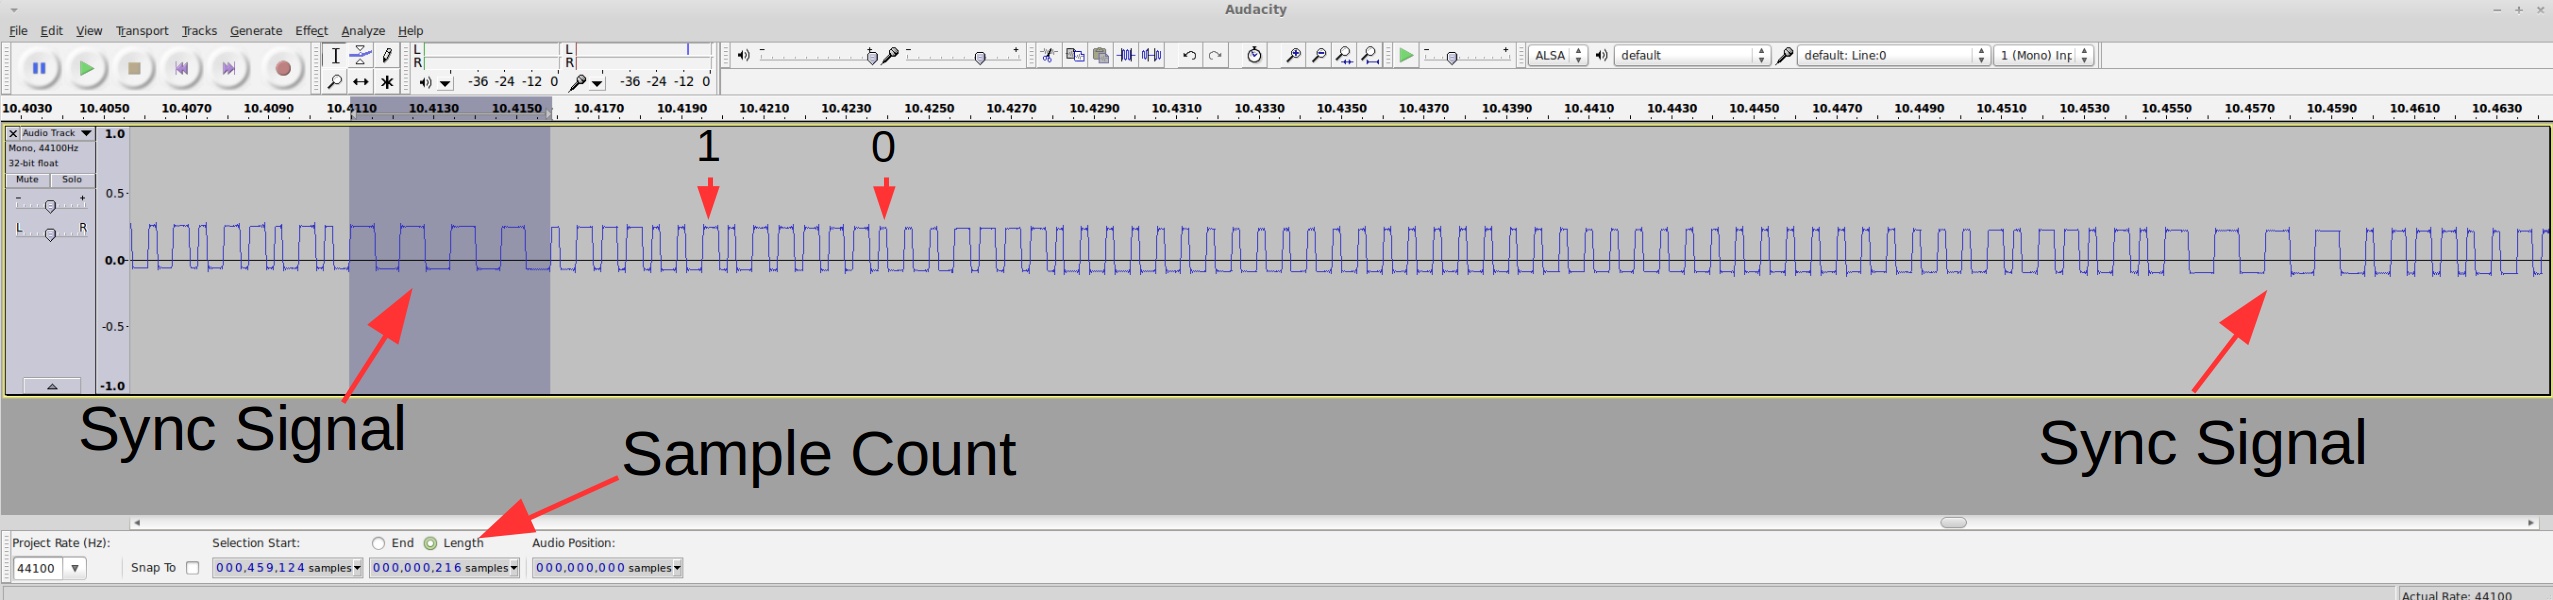
Cool, this looks a lot better. I also made sure every time I pop in the battery I get the same waveform. So what patterns do I see here?
- Each transmission consists of 3 repetitions of the same signal.
- Every two repetitions are separated by a sync signal defined as 4 squarewaves of roughly 1.2ms wavelength.
- The bit patterns are: logic 1 is defined by a constant high of 400us followed by a constant low of 200us; and logic 0 is defined by a constant high of 225us followed by a constant low of 400us.
The sync signal is actually very similar to the humidity/temperature sensor I described in the Part 2. The difference is that there is no 2.25ms constant low preceding the 4 squarewaves.
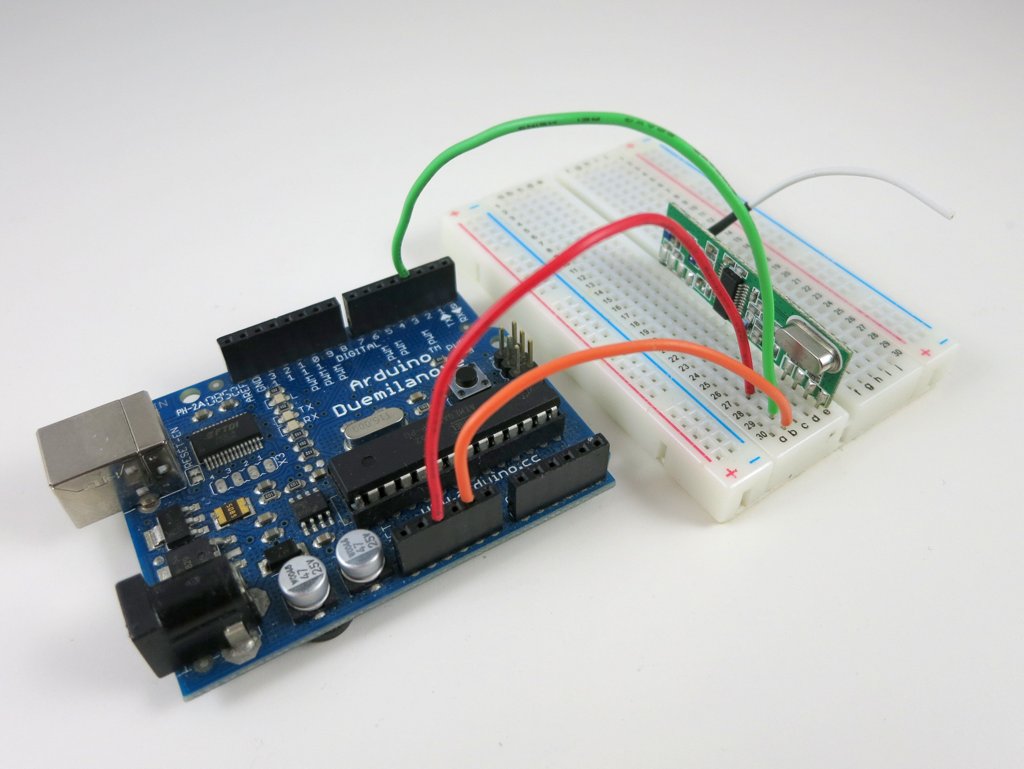
Given the timing data, here is the Arduino program to convert this signal into bits:
- Download the Arduino Program for Sniffing Bits (rain gauge version)
Collect and Analyze Data. The transmitter sends a signal every two minutes, so it’s quite annoying that I had to wait two minutes for every reading. To create variations in data, I simply move the seesaw manually. This way I can precisely control how many clicks occurred between two readings. Here is a list of readings I captured. The numbers in the parentheses are the number of clicks since last reading, and the total number of clicks since the program started.
01110010 11111000 11110000 00000000 00000000 00000000 00000000 01011010 (0 / 0 total)
01110010 11111000 11110000 00000000 00000000 00000000 10000001 11011011 (1 / 1 total)
01110010 11111000 11110000 00000000 00000000 00000000 10000010 11011100 (1 / 2 total)
01110010 11111000 11110000 00000000 00000000 00000000 00000011 01011101 (1 / 3 total)
01110010 11111000 11110000 00000000 00000000 00000000 10000100 11011110 (1 / 4 total)
01110010 11111000 11110000 00000000 00000000 00000000 10000111 11100001 (3 / 7 total)
01110010 11111000 11110000 00000000 00000000 00000000 10001101 11100111 (6 / 13 total)
The encoding scheme is quite obvious: the first three bytes are the signature / device ID; the next 4 bytes record the total number of clicks since the transmitter is powered on. The leading bit of each byte is a parity bit (thanks to the lesson I learned from Part 2!) The last byte is for error checking.
This time I looked at the error checking byte more carefully, and noticed some interesting patterns. For example, everything else being the same, the change in its first bit matches the change of the first bit in the second to last byte. This suggest that perhaps the last byte is a parity byte — specifically, bit 0 is the parity of the first bits in all the preceding 7 bytes, and bit 1 is the parity of the second bit in all the preceding 7 bytes and so on. Just eyeballing the numbers, I believe this looks correct.
I felt quite happy that I made the right choice to abandon the first rain gauge which proved to be too difficult to solve. Well, dodging the challenge is not generally recommended, but in this particular case, I have no regret 🙂
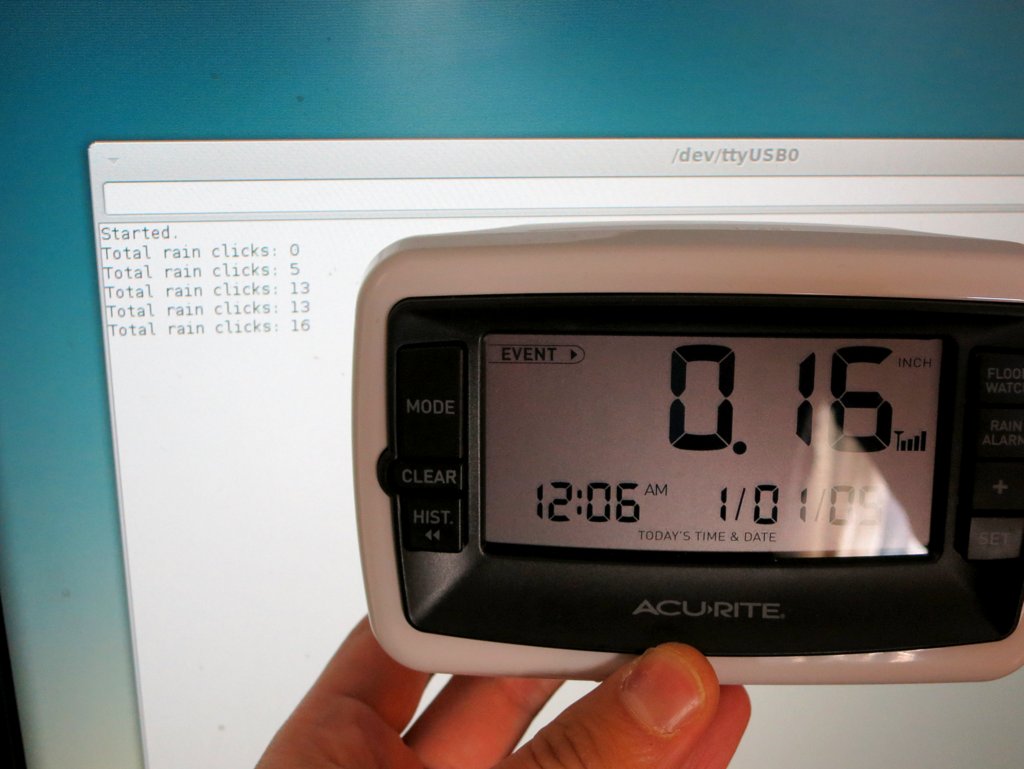
Arduino Program and Validation. Here is the Arduino program that listens to the rain gauge and displays the number of clicks onto the serial monitor. The numbers have been validated with the display unit.
Update: the code is adapted to RPi as well, using wiringPi. The code below uses wiringPi GPIO 2 (P1.13) for data pin.
This concludes the three-part series. If you have comments / questions / suggestions, please feel free to leave them below. Thanks!
New: continue to Part 4, wireless soil moisture sensor.