Continuing from Part 1, this is the second post about how I reverse engineered a few off-the-shelf wireless temperature, humidity, and rain sensors, and used an Arduino to listen to and decode the sensor data. Update: RPi is also supported now! Check the provided programs at the end of this post.
Wireless Humidity / Temperature Sensor
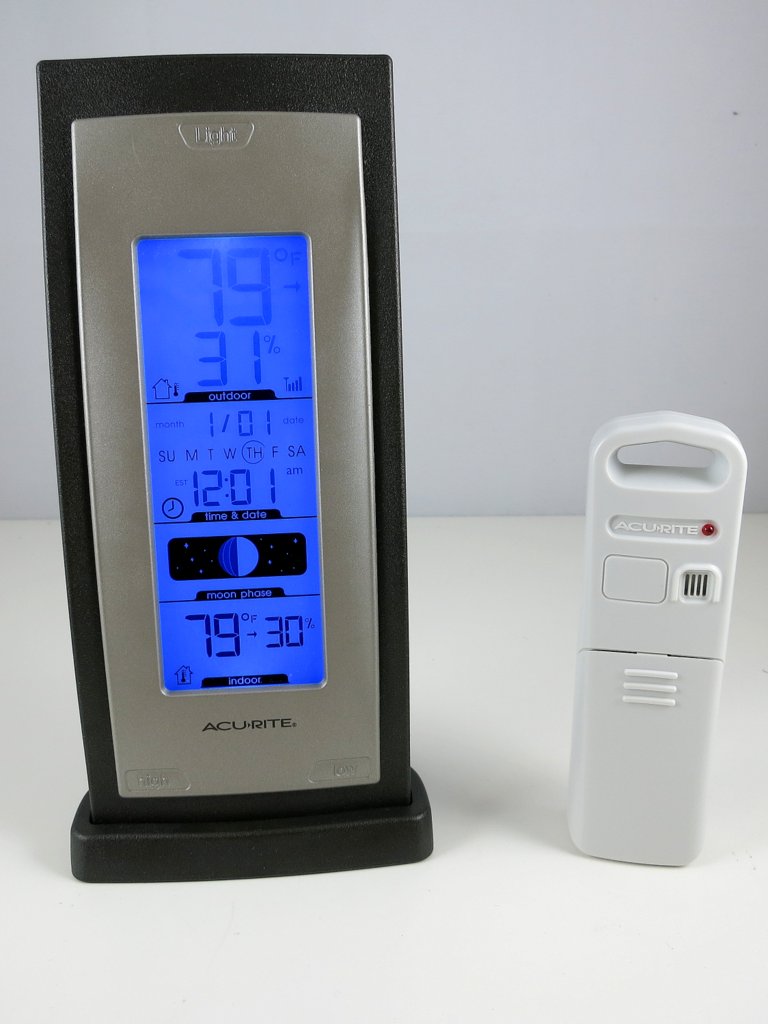
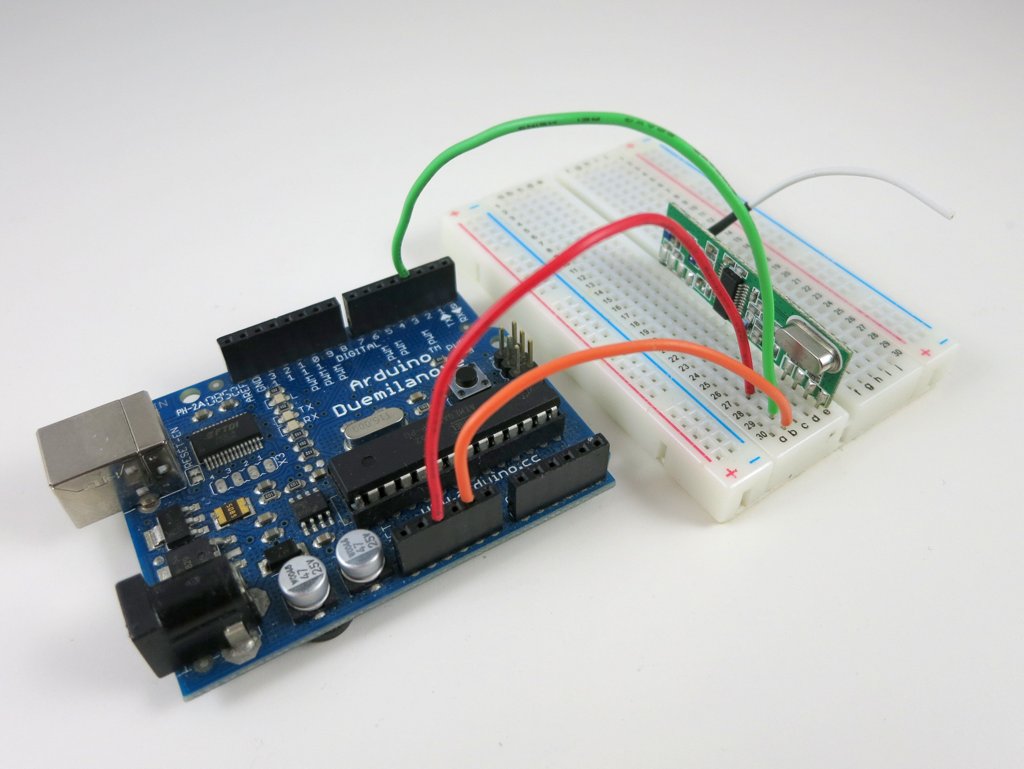
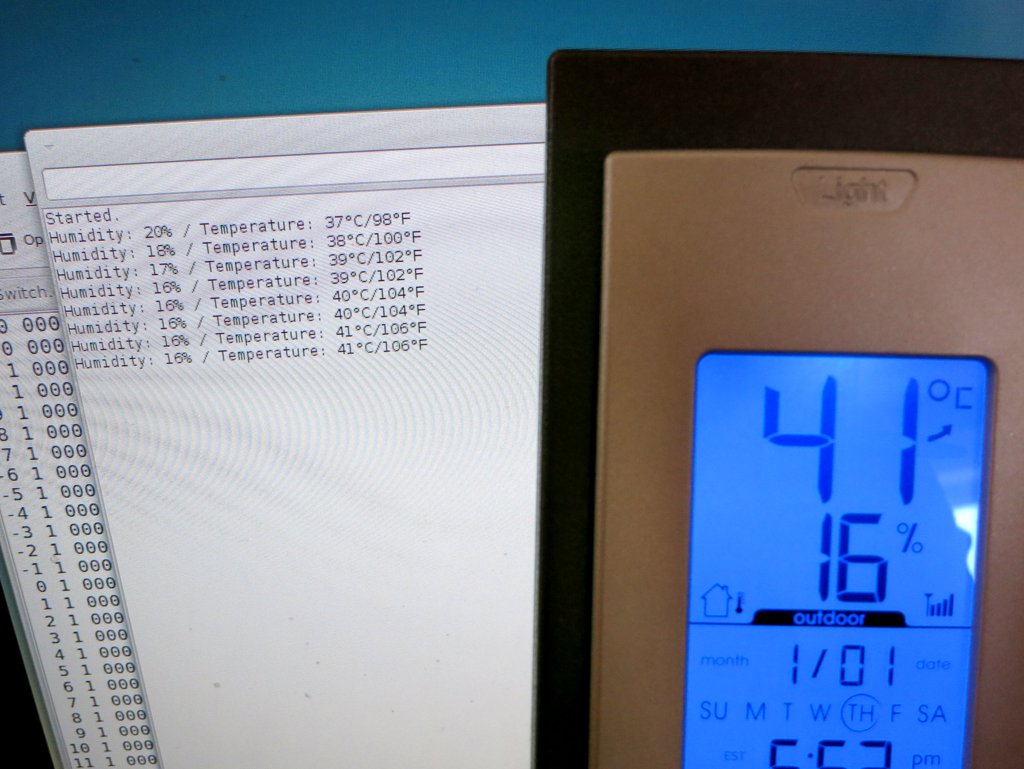
Raw Waveform. The second sensor to tackle is the Acu-Rite 00592W3 humidity / temperature sensor. This one transmits not only temperature but also humidity values. The display unit is a lot larger and looks cooler than the previous (temperature-only) one. Cool, time to get hands dirty. Following the same procedure as before, pop in the battery, power on the RF sniffing circuit, and launch the Audacity recording software, I got a waveform like the one shown on the right image below.
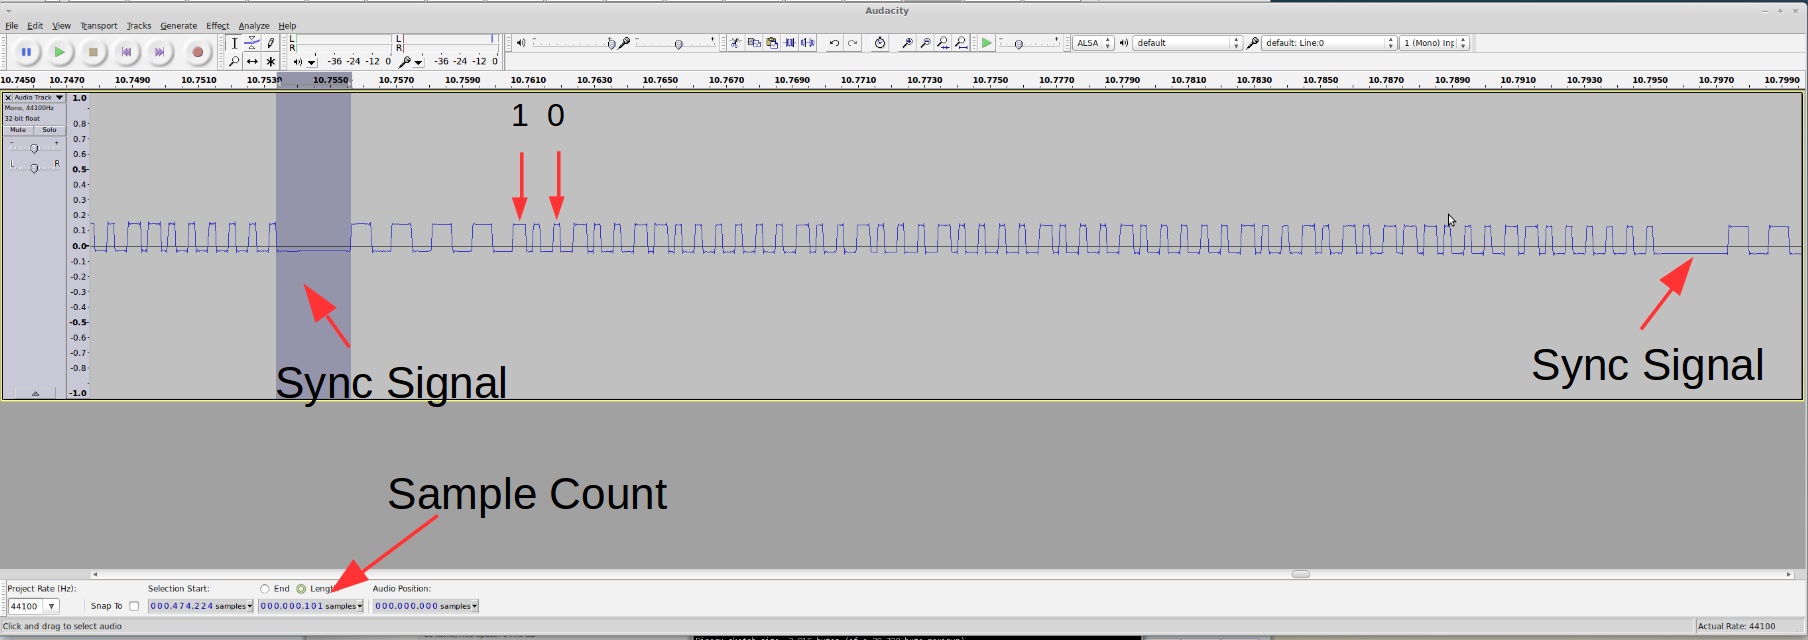
This looks a whole lot longer than before. But the patterns are still quite clear:
- Each transmission consists of 3 repetitions of the same signal.
- Every two repetitions are separated by a sync signal defined as a constant low of 2.25ms (about 100 samples @ 44.1kHz sample rate). This is followed by 4 squarewaves of roughly 1.2ms wavelength.
- The bit patterns are also clear as there are only two types of patterns: logic 1 is defined by a constant high of 400us followed by a constant low of 225us; and logic 0 is defined by a constant high of 250us followed by a constant low of 400us.
Given the timing data, I quickly modified the Arduino program to convert this signal into bits. The only changes are how the sync signal is detected, and how the bit 1 and 0’s are defined.
- Download the Arduino Program for Sniffing Bits (humidity/temperature sensor version)
Collect and Analyze Data. I collected a few groups of data under different humidity and temperature conditions, and recorded the reference values shown on th
e display unit. Given my experience with the first temperature sensor, I set the display unit to show temperature in Celsius, to save myself the trouble of doing the conversion. Here is a selected list of the data:
10010011 00000010 01000100 00100010 00001001 10111110 11000010 (21°C/34%)
10010011 00000010 01000100 00100010 00001001 11000101 11001001 (22°C/34%)
10010011 00000010 01000100 10100011 00001001 11011000 01011101 (24°C/35%)
10010011 00000010 01000100 00100010 00001001 01100101 01101001 (25°C/34%)
10010011 00000010 01000100 00100001 00001001 01101100 01101111 (26°C/33%)
10010011 00000010 01000100 10100000 00001001 11110011 01110101 (26°C/32%)
10010011 00000010 01000100 10100000 00001001 11111001 01111011 (27°C/32%)
10010011 00000010 01000100 10011111 00001010 10000001 00000011 (28°C/31%)
10010011 00000010 01000100 00011110 00001010 10010011 10010100 (29°C/30%)
10010011 00000010 01000100 00010100 00001010 11001001 11000000 (35°C/20%)
10010011 00000010 01000100 10010000 00001010 11010111 01001010 (36°C/16%)
Again, I grouped the data into bits of 8 to make it easy to see the byte values. The first three bytes are the same. Those are probably the signature / channel ID; the fourth byte is clearly correlated with the humidity — if you pick two lines with the same humidity value, the fourth byte is always the same. On close examination, the lowest 7 bits of that byte converts exactly to the decimal value of the humidity. To make it clear, I picked out the fourth byte, and wrote them down together with the reference humidity below:
0 0100010 (34%)
0 0100010 (34%)
1 0100011 (35%)
0 0100010 (34%)
0 0100001 (33%)
1 0100000 (32%)
1 0100000 (32%)
1 0011111 (31%)
0 0011110 (30%)
0 0010100 (20%)
1 0010000 (16%)
Aha, one puzzle is now solved. Not sure what the leading bit is (this will be revealed later), but we can move on to the next puzzle — temperature. Clearly the temperature has to do with only the last three bytes. So let me re-list them below with the reference temperature:
00001001 10111110 11000010 (21°C)
00001001 11000101 11001001 (22°C)
00001001 11011000 01011101 (24°C)
00001001 01100101 01101001 (25°C)
00001001 01101100 01101111 (26°C)
00001001 11110011 01110101 (26°C)
00001001 11111001 01111011 (27°C)
00001010 10000001 00000011 (28°C)
00001010 10010011 10010100 (29°C)
00001010 11001001 11000000 (35°C)
00001010 11010111 01001010 (36°C)
Because the data was recorded as the temperature went up, the first byte is clearly showing the right trend: it goes up as the temperature rises. These are probably the most significant 4 bits. The next byte is not very clear at all: sometimes it goes up, sometimes it goes down. What’s happening here? The last byte is even more elusive: but given my experience with the first temperature sensor, this is probably some sort of error checking code, so let me put it aside for now.
To figure out what’s happening with the second byte, I needed more data. Using my old friends hair blower and fridge, I recorded a larger set of data, and here they are:
00000110 11101011 11011100 (-13°C)
00000110 11111001 11110000 (-12°C)
-------- -------- -------- --------
10000111 00000000 01111000 (-11°C)
10000111 00110101 10110010 (-6°C)
10000111 11010001 01001110 (-3°C)
10000111 11011011 01011000 (-2°C)
10000111 01011111 11011100 (-1°C)
10000111 01101111 11101101 ( 0°C)
10000111 11111001 11111000 ( 1°C)
-------- -------- -------- --------
10001000 00000011 00000011 ( 2°C)
10001000 00010100 10010011 ( 4°C)
10001000 01000001 00111110 ( 8°C)
10001000 11110011 11100100 (13°C)
10001000 01111101 01101110 (14°C)
-------- -------- -------- --------
00001001 00000110 01111000 (15°C)
00001001 00001111 10000001 (16°C)
00001001 00100010 10010100 (18°C)
00001001 11011110 01011111 (24°C)
00001001 11111100 11111001 (27°C)
-------- -------- -------- --------
00001010 00000011 00000001 (28°C)
00001010 00001111 00001101 (29°C)
00001010 11010001 01000100 (36°C)
00001010 01100110 11011001 (38°C)
00001010 11111111 01110010 (40°C)
-------- -------- -------- --------
10001011 10001110 10000010 (42°C)
10001011 00011101 00010001 (43°C)
10001011 01010011 01000111 (49°C)
10001011 01111000 01101100 (52°C)
-------- -------- -------- --------
00001100 10000001 11110110 (53°C)
The second byte still doesn’t show any clear trend; but the first byte is still well behaved: it consistently increments as the temperature rises. That’s re-assuring. I then noticed something very interesting, and that’s why I used dotted lines to separate the data: each dotted line marks where the first byte increments by 1. If you look at the temperature where these changes occur, there is an interesting pattern: the change occurs roughly every 12 degree Celsius.
From my experience with the first temperature sensor, I know that it’s likely the data reflects 10 times the Celsius, so that means the change occurs at about every 120. This is very close to 128. If this is the case, then the lowest bit of the first byte must be the 8-th bit of the actual data (that’s how one bit of increment corresponds to a change of 128), and thus there must be 7 least significant bits following it! Could that be from the second byte?
After staring at the data for a while, I see a path now: if you put together the lowest 4 bits of the first byte and the lowest 7 bits of the second byte, into a 11-bit binary number, this number consistently rises with the temperature. Aha, let me wrote them down here:
0110 1101011 (-13°C) -> 875 => -14.9
0110 1111001 (-12°C) -> 889 => -13.5
0111 0000000 (-11°C) -> 896 => -12.8
0111 0110101 (-6°C) -> 949 => -7.5
0111 1010001 (-3°C) -> 977 => -4.7
0111 1011011 (-2°C) -> 987 => -3.7
0111 1011111 (-1°C) -> 991 => -3.3
0111 1101111 ( 0°C) -> 1007 => -1.7
0111 1111001 ( 1°C) -> 1017 => -0.7
1000 0000011 ( 2°C) -> 1027 => 0.3
1000 0010100 ( 4°C) -> 1044 => 2
1000 1000001 ( 8°C) -> 1089 => 6.5
1000 1110011 (13°C) -> 1139 => 11.5
1000 1111101 (14°C) -> 1149 => 12.5
1001 0000110 (15°C) -> 1158 => 13.4
1001 0001111 (16°C) -> 1167 => 14.3
1001 0100010 (18°C) -> 1186 => 16.2
1001 1011110 (24°C) -> 1246 => 22.2
1001 1111100 (27°C) -> 1276 => 25.2
1010 0000011 (28°C) -> 1283 => 25.9
1010 0001111 (29°C) -> 1295 => 27.1
1010 1010001 (36°C) -> 1361 => 33.7
1010 1100110 (38°C) -> 1382 => 35.8
1010 1111111 (40°C) -> 1407 => 38.3
1011 0001110 (42°C) -> 1422 => 39.8
1011 0011101 (43°C) -> 1437 => 41.3
1011 1010011 (49°C) -> 1491 => 46.7
1011 1111000 (52°C) -> 1528 => 50.4
1100 0000001 (53°C) -> 1537 => 51.3
The single arrow points to the decimal value of the 11-bit number. There is obviously an offset of 1024, so I subtracted the value by 1024 and then divided it by 10. The result is shown following the double arrow.
Now we are almost done. If you compare the result with the reference temperature, there is still some difference, like a 1.6 to 1.9 degree constant shift. This is probably due to calibration. The shift seems consistent, so I picked 1.9 as an empirical number. Putting everything together, the temperature is calculated as: [(11-bit number – 1024) / 10 + 1.9] rounded to the nearest integer.
Parity Checking Bit. At this point you have probably already figured out about the mysterious leading bit (which I ignored above). It is a parity bit — it shows if there are an odd or even number of 1’s in the remaining 7 bits. It’s the simplest form of error detection. Because the first temperature sensor I worked with did not have a parity bit, I didn’t think about it immediately. It’s only after I figured out about the temperature encoding scheme that I came to realize the leading bit must be used for error checking. Here is a summary of the encoding scheme:
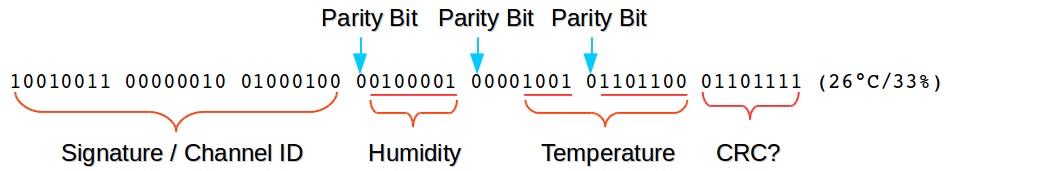
At this point, the last byte is still a mystery — as I said, it’s likely some sort of CRC checking code. Perhaps the experts can shed some light here?
Arduino Program and Validation. It’s now time for the final test. Here is the Arduino program that listens to the transmitter and displays the humidity / temperature value to the serial monitor.
Update: the code is adapted to RPi as well, using wiringPi. The code below uses wiringPi GPIO 2 (P1.13) for data pin.
The result matches the display unit quite well. Cool. Mission accomplished!
Continue to Part 3 and Part 4, or Back to Part 1.