In this and the next two three blog posts (Part 2, Part 3, and Part 4), I will describe how I reverse engineered a few off-the-shelf wireless temperature, humidity, and rain sensors, and used an Arduino (Update: RPi is also supported now!) to listen to and decode the sensor data. This has been a really fun journey and I will document the process as thoroughly as I can. Because there are lots of details, I don’t want to jam everything into a single post, so I have split the whole story into three posts. The Arduino and RPi programs are provided at the end of each post.
Introduction
The first question to ask is always: why am I doing this? Well, for good reasons: these off-the-shelf sensors are cheap, well-built, outdoor-proof, battery-driven and power efficient. If your project needs local weather data and you don’t want to spend time building your own transmitter units (which would bring up a whole bunch of engineering issues), these cheap sensors are the way to go. My original plan was to make use of the sensor data for sprinkler control systems. I actually set this as my next challenge to tackle in a blog post I wrote two years ago. It’s a shame that I lost track of it since then. But hey, two years later, I finally finished it. Better late than never!
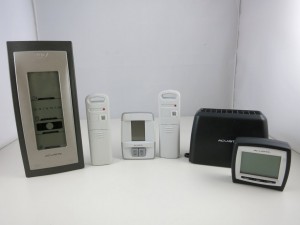
Here are the three sensors that I gathered and will use as examples in the following. They all work in the 433MHz frequency band.
Disclaimer: I am not associated with Acu-Rite in any ways, I just picked these sensors because they are common in retail stores.
Preparation
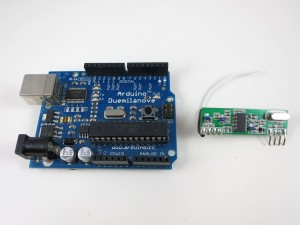
The tools involved are quite simple: I used an Arduino and a 433MHz receiver. You should use the superheterodyne type of receiver as it has very good signal-to-noise-ratio. The super-regenerative type is too noisy and will only work in short range.
Also, to obtain an initial waveform in order to bootstrap the process, I used a RF sniffing circuit from my previous blog post (about interfacing with remote power sockets), a PC with line-in port, a 3.5mm audio cable, and the free Audacity software. If you don’t have a PC with line-in port (most laptops these days don’t have), you can buy a USB sound card which has line-in port.
Wireless Temperature Sensor
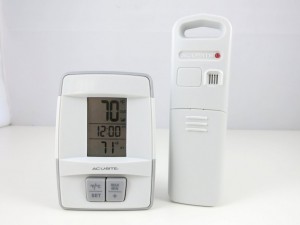
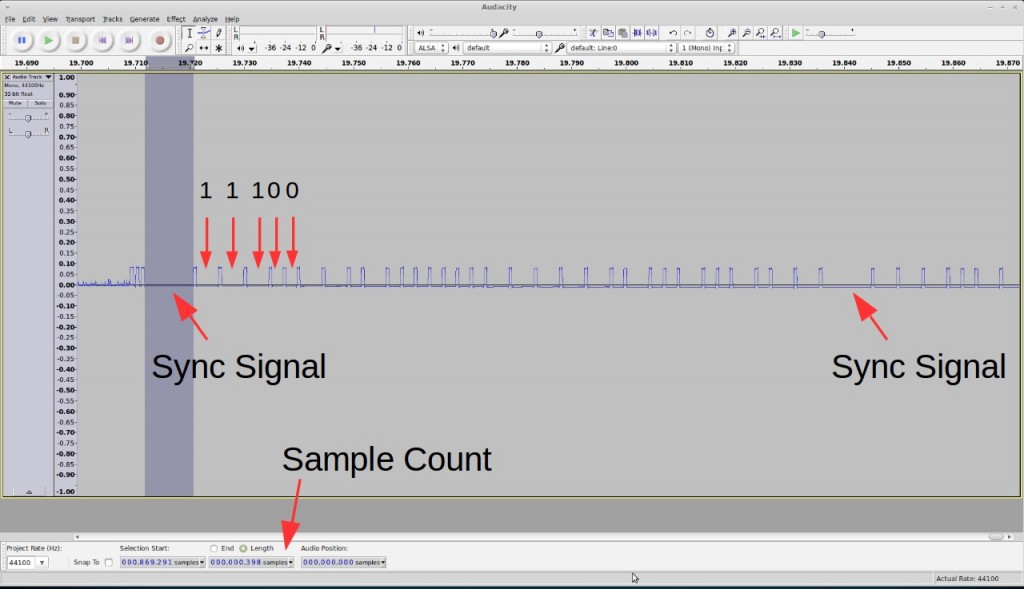
Raw Waveform. The temperature sensor is the simplest, so let’s take it down first. What I have at hand is an Acu-Rite 00782W3 indoor/outdoor temperature sensor. The package includes a receiver display unit, and a transmitter which sends a temperature reading every 1 to 2 minutes. Pop in the battery, power on the RF sniffing circuit, and launch the Audacity recording software, I got a waveform like the one shown on the right image below.
By carefully looking at the waveform, I found the following patterns:
- Each transmission consists of 8 repetitions of the same signal.
- Every two repetitions are separated by a constant low sync signal that’s roughly 400 samples (in Audacity you can select a region and see the sample count). Given that the sampling rate is 44.1kHz, this is roughly 9.0ms (400 / 44.1 = 9.07).
- The bit patterns are pretty clear: logic 1 is a constant low of about 180 samples (4.1ms), and logic 0 is a constant low of about 95 samples (2.1ms). Every two bit is separated by a constant high of about 24 samples (0.54ms).
arduino
Given the patterns, I then manually wrote down entire sequence of bits. For example, the image above shows a signal that’s:
11100110 10000000 11111010 01001011
I grouped them into bits of 8 so it’s easy to see the byte values. I also recorded the reference temperature displayed on the receiver unit at the time of capture, which is 77 degree Fahrenheit. At this point we don’t know yet how the bits are encoded (i.e. how they translate to 77). None of the bytes is directly equal to 77. But this is ok — if it was that easy, it wouldn’t have been fun any more 🙂
Create Temperature Variations. In the next step, I will create temperature variations so I can get a lot of different signals and reference readings. By checking how the signal changes, hopefully I can decipher the coding pattern. How do I vary the temperature? Simple: use a hair blower to increase the temperature, and throw the sensor into a fridge to decrease the temperature.
But I am not in a hurry to do that just yet — manually translating the waveform into bits is very tedious, and I worry that if I make a mistake that can compromise the analysis. So I need a way to automate the signal capturing process. Since I already know the signal timings, I can create an Arduino program to automatically translate the waveform into bits. This will make the capturing process a lot faster.
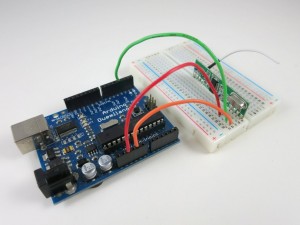
An Arduino Program for Bits Conversion. To get started, I connected the VCC, GND, and DATA pins of the RF receiver to Arduino’s 5V, GND, and D3 (interrupt 1). Then I wrote an interrupt handler to process the captured signal and convert it to bits. Earlier I’ve studied the RCSwitch library, which gave me a good idea of implementation.
Technically, the interrupt function is triggered every time the signal changes from high to low (falling edge) or low to high (rising edge). A ring buffer is used to track the timing between every two triggers. It then checks the timing to see if a sync signal (roughly 9.0ms) is present. Because the signal may still be noisy the first time the sync signal is received, we will wait till the second or third time it’s received to actually do the bits conversion.
- Download the Arduino Program for Sniffing Bits (temperature sensor version)
Collect and Analyze Data. Now let the fun begin. With the Arduino program, I gathered a lot of data under various temperatures. Make sure to also gather some low temperature reading by putting the sensor in a fridge: I was surprised that the signal can actually go through a fridge door! Here is a selected list. The number at the end of each line is the reference temperature value shown on the display receiver.
10001011 10000001 00111110 00111101 (89°F)
10001011 10000000 11100100 01010001 (73°F)
10001011 10000000 10101101 00011011 (63°F)
10001011 10000000 00000111 00001010 (33°F)
10001011 10000000 00000001 01010000 (32°F)
10001011 10001111 11111011 00010111 (31°F)
10001011 10001111 11100010 10111010 (26°F)
10001011 10001111 11001011 10100101 (22°F)
10001011 10001111 01111100 10011010 ( 8°F)
Now the coding pattern is a lot more clear. The first byte is always the same, so it’s probably a signature or channel byte. This is used to avoid interference among multiple transmitters. Note that this byte is different from the one I manually wrote down, so I suspect the transmitter changes the signature every time it’s powered on. The second and third bytes show a clear trend as the temperature goes down. The last byte has no clear trend. It’s possibly some sort of CRC checking byte.
So how do the middle two bytes translate to the temperature values? Well, if you look at the 32°F line: the middle two bytes are very close to 0 (ignoring the leading 1). Since 32°F is roughly 0°C (Celsius), is it possible that the middle two bytes give the temperature in Celsius? After converting the reference temperature values to Celsius, the puzzle is instantly solved (the arrow below points to the decimal value of 12 bits shown in blue):
10001011 10000001 00111110 00111101 (32°C) -> 318
10001011 10000000 11100100 01010001 (23°C) -> 228
10001011 10000000 10101101 00011011 (17°C) -> 173
10001011 10000000 00000111 00001010 ( 1°C) -> 7
10001011 10000000 00000001 01010000 ( 0°C) -> 1
10001011 10001111 11111011 00010111 (-1°C) -> -5 (two's complement)
10001011 10001111 11100010 10111010 (-3°C) -> -30 (two's complement)
10001011 10001111 11001011 10100101 (-5°C) -> -53 (two's complement)
10001011 10001111 01111100 10011010(-13°F) ->-132 (two's complement)
So the temperature, in Celsius, is given by the 12 bits (shown in blue), divided by 10, and rounded to the nearest integer. Aha, that’s it! Now I can modify the Arduino program to not only print out the bits, but also decode the signal and get the real temperature values displayed onto the serial monitor.
Update: the code is adapted to RPi as well, using wiringPi. The code below uses wiringPi GPIO 2 (P1.13) for data pin.
Note that the program uses pretty tight margins (1ms to 2ms) for screening the signal timings. Depending on the quality of your 433MHz RF receiver, you may have to increase the margin to improve error tolerance.
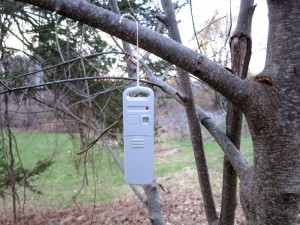
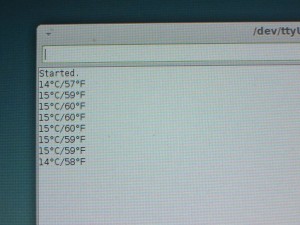
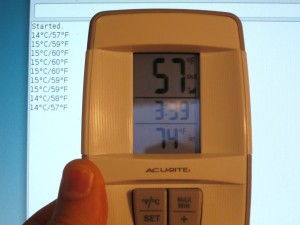
I did some quick testing by hanging the temperature sensor outside on a tree. Then I compared the temperature value reported on the serial monitor and the reference temperature displayed on the receiver unit. The two matches very well. Cool, mission accomplished! 🙂
Summary of the Process
- Use the RF sniffing circuit and Audacity to capture an example signal; examine the signal and estimate timing information.
- Write an Arduino program to automatically capture signals and convert them into bits.
- Collect a lot of data, record the bits and write down the reference temperatures.
- Examine the changes in the bits as the reference temperature changes, identify those bits that matter, and reason about how they translate to the reference value.
- Modify the Arduino program to decode the bits into temperature value.
Continue to Part 2, Part 3, and Part 4.
